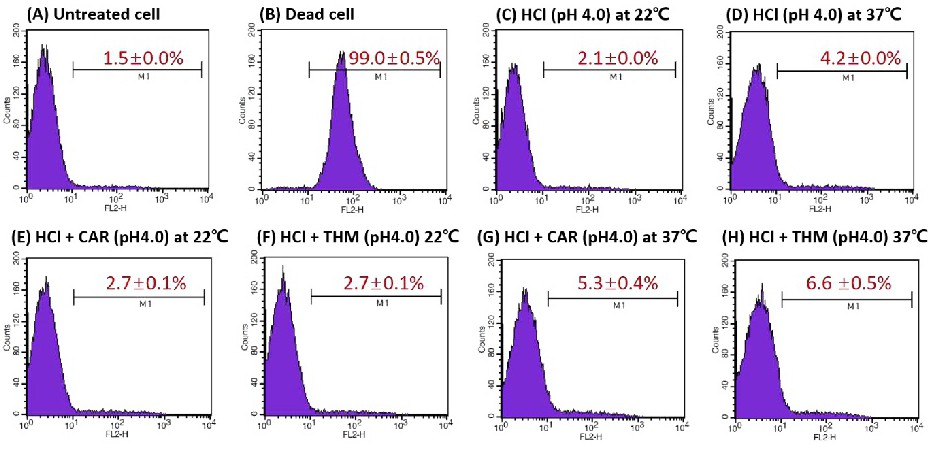
Fig. 5. Flow cytometry analysis with PI staining showing the membrane damage of C. albicans cells that were untreated (A) or treated with 100% EtOH for 10 min to make dead cells (B), HCl (pH 4.0) alone for 10 min at 22oC (C) or 37oC (D), HCl + 1.5 mM CAR (pH 4.0) and HCl + 1.5 mM THM (pH 4.0) for 10 min at 22oC (E and F) and for 10 min at 37oC (G and H). The percentage of cells in M1 shows the mean ± standard deviation (n = 3).